The tools you’ll need
In order to work with data, build interactive visualizations and publish them on your personal J560 website, you will need access to several pieces of software and tools.
For data
- Microsoft Excel – A well-known spreadsheet app for working with data
For writing code and uploading your website
(Below are suggested apps; alternative code-editing, VPNs and FTPs are acceptable, and if you wish, you may provide your own hosting)
- Sublime Text — App for writing HTML, CSS and Javascript (it’s free)
- Duo Two-Step Login is required for all students. Be sure to have your primary device at hand when uploading to Pages so you can log in to secure IU systems and authenticate each file upload.
- Ivanti Secure — A VPN to allow you to access the Pages server to publish your site
- Cyberduck — An FTP to allow you to move files to the Pages server
For creating visualizations
(All of these are either free, have free versions or allow for 30-day trials)
- RawGraphs — A free and open-source online tool for chart visualizations
- Flourish — An online tool for static or interactive visualizations, including maps
- DataWrapper — As above, though with enhanced mapping features
- Highcharts — More code-intensive library for charting written in pure JavaScript
- Observable — An online tool to build “notebooks” to explore and visualize data
Readings

We will have weekly readings, closely associated with the work we are doing for each deliverable. Some of these readings are available through IU libraries, though some would require an interlibrary loan. You can use the Canvas Raeding List for this course to request the books, and we will provide some as PDFs.
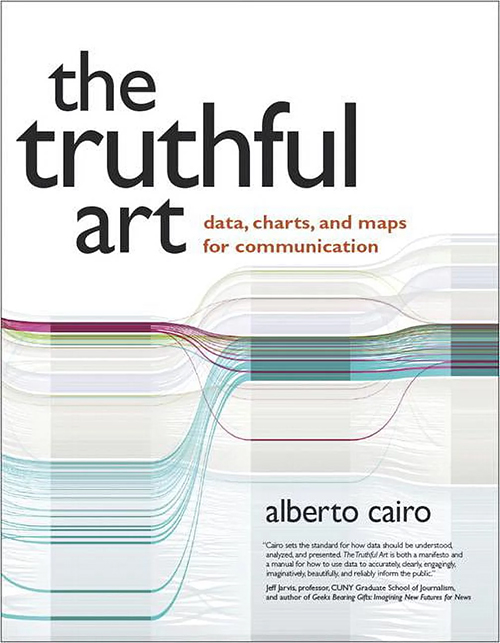
This course includes a series of chapter readings from “The Truthful Art: Data, Charts, and Maps for Communication” (Alberto Cairo, 2016). The book can be purchased from Amazon.com for $49.95, and there's a Kindle version if you prefer.
Other assigned readings will include chapters from:
- Borner, K., & Polley, D. E. (2014). Visual insights. MIT Press.
- Duckett, Jon (2014). JavaScript and jQuery: Interactive Front-End Web Development. Wiley.
- Holmes, N. (2023). Joyful infographics: A friendly, human approach to data. CRC Press, Taylor & Francis Group.
- Krug, S. (2013). Don’t make me think, revisited: A common sense approach to web usability. Pearson Education.
- Kuang, C., & Fabricant, R. (2019). User friendly: How the hidden rules of design are changing the way we live, work, and play. MCD/Farrar, Straus and Giroux.
- Rosling, H., Rosling, O., & Rönnlund, A. R. (2020). Factfulness: Ten reasons we’re wrong about the world - and why things are better than you think. Flatiron Books.
- Shirky, C. (2010). Cognitive surplus: Creativity and generosity in a connected age. Penguin Press.
- Tufte, E. R. (1990). Envisioning Information. Graphics Press.